Table of Contents
- Introduction
- Monitoring and reprogramming
- Scheduling
- Self-healing
- Proposed Check Demonstration Sketch
Introduction
The Check Management Protocol Suite is an innovation that was carried out by UPB in WP4, and it contains components for simple reprogramming, management, task-scheduling and self-healing. Check offers a monitoring and actuation framework for heterogeneous WSAN islands crossing the borders of different organizations with different network setups, which will work toward the realization of the scalable internetworking, horizontalization and heterogeneity design goals of the SENSEI System. The monitoring of all the components of Environmental Sensor Networks (ESN), Community Sensor Networks (CSN), and Body Sensor Networks (BSN), such as load, link quality, processor and radio usage on the nodes, as well as enabling actuation in these networks, is not yet fully solved in a fully heterogeneous environment. The Check Suite addresses this point by implementing multi-hop task-scheduling algorithms, based on multi-hop routing schemes for homogeneous wireless sensor networks. In WSANs, packets are typically forwarded in first-come first-served order. However, this scheduling does not work well in real-time networks where packets have different end-to-end deadlines and distance constraints. The multi-hop task-scheduling scheme from the Check framework needs topology information from the network, which will be gathered using network discovery algorithms. Task-scheduling is a fundamental requirement for various subsystems of WSAN islands. It can be used, for example, in the smart places scenario to reschedule the appointments at the post office or the shopping mall, and in the worker in a plant to enable the parallel execution of tasks and to prevent workers from performing conflicting operations. Present research on scheduling is generally focused on hard time deadlines. Instead, the Scheduling component of the Check Suite proposes a solution where energy consumption, battery awareness, availability and affinity are considered as more important than execution time. The last component provided by the Check Management Protocol Suite is the availability of a high-level, service-oriented self-healing strategy. Here the WSAN is regarded here as a service provider. Check thus offers a high-level framework for assuring service availability in WSANs. Whenever a component of a WSAN island fails, it is of paramount importance that the functionality it provides is not lost, to ensure the availability and reliability of the services being offered. Check Self-Healing is the SENSEI component providing the recovery strategies employed when these events occur. Services can be allocated to nodes by the Check-Scheduling component of the Check Suite. The self-healing component identifies failing or poorly performing services and signals and orders the scheduler to reallocate them or reallocates them itself and configures the nodes directly. The self-healing algorithms can manage multiple WSAN islands through the Check – Monitoring and Reconfiguration management component, and can thus move services in heterogeneous WSAN islands if data dependencies allow it. It must also be noted that this coupling of the Self-Healing and Monitoring components, by being able to gather information from a wide variety of devices, using many operating systems and offering numerous services, will provide a hardware- and operating system-independent mechanism for service-level self-healing in the SENSEI system.
Architectural Overview

The Check architecture consists of the following entities:
- WSN Island: Sensor nodes organize into a multi-hop wireless network with tree topology in which some nodes act as routers for the end node leaves.
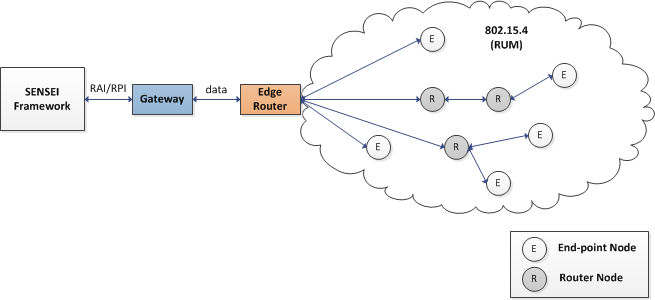
- Edge Router: An embedded network coordinator. Acts as a sink to the sensor node data and routes the island network traffic to an IPv6 network.
- Gateway: Binary Web Services (COAP) running on a machine in the same network with the Edge Router.
- Check Services: Self-healing, Task Scheduling and Monitoring Framework.
Hardware-Software Architecture
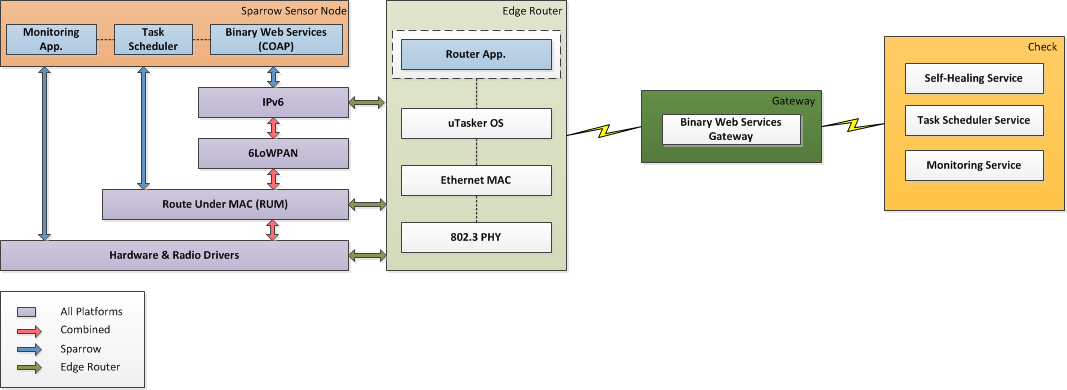
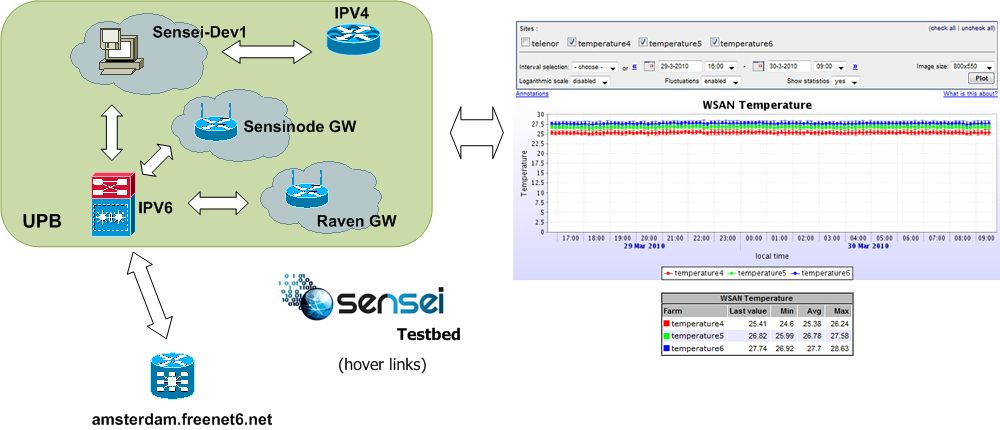
An entire Check WSN architectural example is given in the diagram below. The sensor network itself is built around RZRAVEN and Sparrow nodes that form a heterogeneous multi-hop network using a modified version of Atmel's RUM protocol over which we ported the Binary Web Services application and our own task scheduling and monitoring apps.
The edge router is an embedded ARM7 board running a modified version of the uTasker OS. An IPv6 layer added over the existing OS allows the SAM7X platform to act as an IPv6 Edge Router in addition to an 802.15.4 PAN Coordinator. The PAN Coordinator performs the classical functions defined in section 5.3 of the IEEE 802.15.4-2006 specification. It will start and maintain a non-beaconing network. The edge router functionality will route IPv6 network traffic to the appropriate end and router nodes based on their specific IPv6 addresses. SAM7X provides multiple interfaces for users to interact with the 802.15.4 wireless network. Among these are RS232, USB, telnet and simple direct web interface.

The Gateway service acts as a mediator between the network and the Check framework service suite.
Hardware Requirements
In order to build a working WSN Island, the following devices and tools are needed:
- Ubuntu or Windows PC.
- RZRAVEN or Sparrow nodes
- AT91SAM7X-EK development board with an attached AT86RF2xx family transceiver (RZ502 kit + REB extension board recommended)
- AVRISP, or any other compatible programmer for the sensor nodes.
- AT91SAM-ICE, or compatible JTAG emulator for the edge router.
Software Requirements
- avr-gcc compiler or WinAVR (for Windows)
- avr-dude programmer or AVRStudio (Windows)
- Jlink programmer for the edge router.
- Source code for the sensor nodes
- Gateway code
Optional (for the edge router):
Installation
Sensor nodes:
- Edit the PLATFORM option in this Makefile to match your hardware (RAVEN for RZRAVEN, leave undefined for Sparrow)
- Compile the code using the above Makefile or use one of the precompiled binaries can be found in the AVR folder.
- Program the binary into the flash memory of the node using avr-dude or AvrStudio?.
Edge Router:
- Program the edge router with this SAM7X_2400mhz_ipv6_coord.bin binary using Jlink
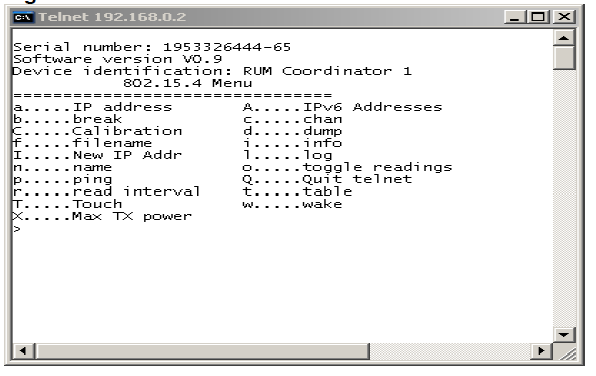
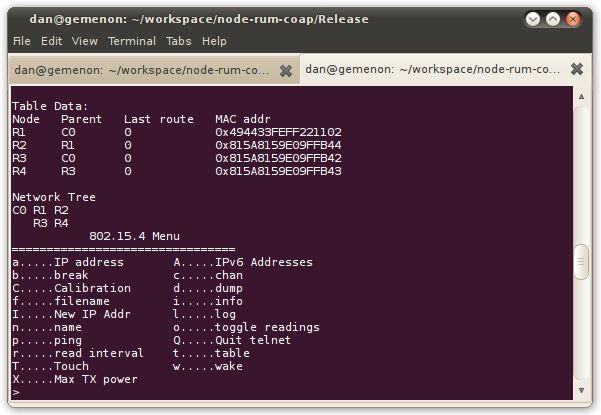
- Telnet the router (its default IP address should be 192.168.1.125). You should gain access to the following interface:

- Turn on the Raven or Sparrow nodes. The Raven nodes emit an audible signal when connected to the net. You should see them joining the network and view the network tree by entering the "t" (Network Table) command.
- On the telnet interface you should see some basic text messages each time a node connects to the gateway. By entering the 't' command from the menu, you should be able to visualize the network structure, like in the picture below:

Gateway:
- Compile and run the COAP gateway code on the machine that is connected to the edge router.
Monitoring and reprogramming
Reprogramming - Gateway Watchdog
The SENSEI Gateway Watchdog is a monitoring and control service for the SENSEI Gateway. It allows for remote starting, stopping and updating the gateway code and can report the version string and up-time of the currently running gateway binary.
Software Requirements
Installing the Gateway Watchdog requires the following software packages:
- Linux PC (Ubuntu)
- g++, make
- Sockets C++ library (Also included in lib/Sockets-2.3.7; make clean; make; make install)
- libxml2, libxml2-dev
- libssl, libssl-dev
Project Organization
The watchdog shares its code with the gateway implementation and can be found here.
- /bin executables
- /src Gateway and Watchdog Code
- /xml Location of resource descriptions
- /lib Sockets++ library
- /config Configuration files (unused)
- /log Log files (unused)
Compiling the Gateway Watchdog
Some packages are required to be installed prior to the compilation of the Gateway Watchdog. Please install the following packages from the Ubuntu repository if you did not do already so.
$ sudo apt-get install gcc g++ libssl-dev libxml2-dev
Sockets library also needs to be installed:
$ cd ./lib/Sockets-2.3.7
$ make clean
$ make
$ sudo make install
The top-level Makefile will build everything with the following, which places the executables in ./bin.
make
To clean everything do
make clean
Running the Gateway Watchdog
The watchdog must be run from the root of the project
./bin/watchdog
Available command line options are:
-p HTTPD port (default: 9000)
-s HTTPD hostname for inserting in resource description (default: localhost)
-d domain name inserted in resource description (default: example.com)
-w WSAN island name inserted in resource description (default: Example)
-f folder where the gateway binary can be found (default: ./)
-c gateway binary filename (default: sensei-gateway)
-cert ssl certificate filename, also enables https operation
-pass ssl certificate passphrase, necessary if the certificate file is encrypted
The SENSEI Gateway Watchdog server runs by default on port 9000. It exposes the following URIs:
- /start - a POST request starts the gateway if not already started
- /stop - a POST request stops the gateway
- /update - a POST request with a form that has a 'file' field named 'code' updates the gateway binary, a 'text' field named 'version' can also be sent as the version string for the newly uploaded binary, otherwise version string will be taken from the uploaded file
- /uptime - a GET request returns the up-time of the gateway in seconds or -1 if the gateway is not started
- /version - a GET request returns the gateway version string, if one is available.
For the /start, /stop and /uptime urls GET requests are also accepted. They return an HTML page that allows easy access to the operations from a browser.
Test demo
The Gateway Watchdog provides monitoring and control of the SENSEI Gateway. To run a demo, please start the Watchdog service by giving the following commands in a console:
$ make
$ ./bin/watchdog -f bin/ -c sensei-gateway -d pub.ro -w test
This will start the Gateway Watchdog which runs an http server at localhost:9000. You will be able to see the registered gateway watchdog URIs by querying the Resource Directory at http://sensei-dev1.grid.pub.ro:8184/rd. A possible response from the Resource directory is shown below.

The watchdog service will now accept requests at the following URIs:
- Start Gateway http://localhost:9000/start
- Stop Gateway http://localhost:9000/stop
- Update Gateway code http://localhost:9000/update
- Gateway uptime http://localhost:9000/uptime
- Gateway version http://localhost:9000/version
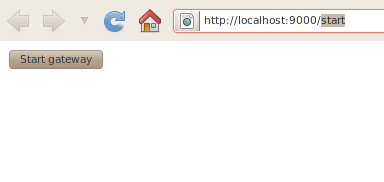
As an example, by pointing your browser to the Start Gateway URI you should see following response

Clicking the Start button will start the gateway if it is not already started. You can check that the gateway is running by clicking the following link http://localhost:8000
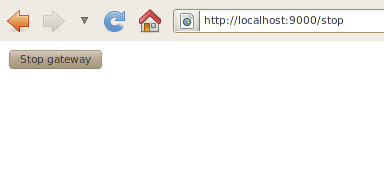
By pointing your browser to the Stop Gateway URI you should see the following response

Clicking the Stop button will stop the gateway.
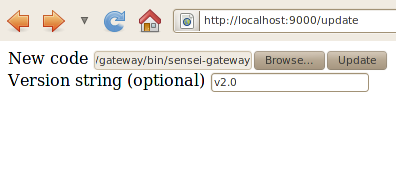
By pointing your browser to the Update Gateway code URI you will be able to upload a new binary to the gateway and, optionally, specify a version string for this binary, as shown bellow.

Note that to run the new gateway code you have to stop and then start the gateway.
Monitoring Sensei Resources
The monitoring component of Check is pluginable. Check does not internally store monitoring information, but uses other monitoring suites to provide these services. In this case, we use a MonAlisa service. This service is used to store and graph data for large amounts of time. Check plugs itself as a resource into the Resource Directory and can be used by any service by using a rest interface to register new nodes and parameters to monitor.
Software Requirements
Installing this component requires the following software:
- Java 6 (http://java.sun.com)
- MonAlisa Service (http://monalisa.cern.ch) to monitor sensors
- MonAlisa Repository (http://monalisa.cern.ch) to store data for long periods of time and register new nodes to be monitored
Project Organization
If you have access to the Source Code Repository the code resides in the /management directory.
- /SenseiRepos? - !ML Repository files and configuration
- /SenseiService? - Monitoring Plugins
- /SenseiHibernate? - Rest Monitoring Interface for Check (must be moved here)
Compiling the plugins
For SenseiService?, copy it to ${MONALISA_HOME}/Service/usr_code/SenseiService. To compile, use
compile.sh
To use a dry run, use
run_test.sh
Running the plugins
To enable the monitoring plugins you must configure the service like this. First enable the check monitoring plugins:
#
# Properties to add
#
lia.Monitor.CLASSURLs=file:${MonaLisa_HOME}/Service/usr_code/SenseiService/build/
Available plugins are:
- monSensei - monitors resources using REST. The resources to monitor are given by the REST interface of Check.
- monPing6 - monitors the status of a node by pinging it through IPv6 ping.
- monService - checks the availability of a service.
Now we must enable them:
#
# To add in myFarm.conf
#
*Topology
>gw.ncit.pub.ro
monPing%60
Demo
The data is stored in a local database for three hours. For long term storage we use a dedicated database, see SenseiRepos? trunk.


Scheduling
The Scheduling algorithm is presented as a stand-alone application that gathers information about the network from a Resource Directory (types of nodes, topology).
Prerequisite: Prior to executing the scheduler the sub-tasks of the application have to be already programmed on the nodes, as stopped tasks.
./check-schedule <RD> <tdag> <tskmap>
Arguments:
- RD is the URI of the Resource Directory
- tdag is a Task Dependency Acyclic Graph. It contains a graph of data dependencies between tasks and their associated bandwidth. The format is a textfile containing
- t, number of tasks
- d, number of dependencies
- a tuple (x,y,z) for each edge in the dependency graph on one line, with x,y being incident tasks and z being the bandwidth.
- tskmap is a task mapping file, associating each task in Task Dependency Acyclic Graph to the names of the tasks that have to be run on the network.
- tuples (x,s) are present on every line, x being the task index in the tdag file and s being the name of the task associated. Tasks are started based on their names
Example of a tdag file:
The application in question has one sensing task (0) and two different event detections (tasks 1 and 3) and a sink task to notify in the case of an event (task 2)
4 4
0 1 10
1 2 1
0 3 20
2 3 1
The associated tskmap will be:
0 sense
1 ed1
3 ed2
2 present
One run of the application is enough to calculate the best scheduling of the application over the network, the application will directly access the nodes and start the required tasks, provided the tasks are already present on the sensor nodes.
We used an unconventional scheduling algorithm that used energy as main constraint instead of time. The scheduler has only basic information about the tasks, for example: importance, affinity to a certain node, running frequency and dependencies and chooses which assignment is best for a minimal energy consumption scheme. Energy costs are considered to be proportional to the quantity of data transmitted
The algorithm proposed solves the schedule problem with minimal energy consumption. It is designed for heterogeneous networks and it is application-independent. Although it was described as for a mesh topology network, the idea can be easily extended by introducing a “hop” factor in the communication between certain nodes - as dictated by topology.
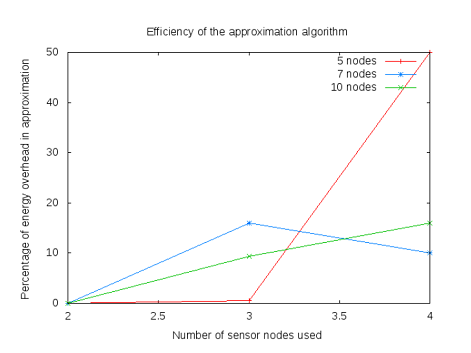
The scheduler suffers from great algorithmic complexity, a different solution based on an approximation algorithm of the same problem is required for large-scale networks. A viable approach would be to use the theorem in, that states that the k-cut problem can be solved with Gomory-Hu trees within twice the optimal. An implementation based on this approximation, as detailed in, has proven to be within twice the optimal, as shown in Figure 1.

Percentage of addition to the optimal of the approximation solution - Twice the optimal is represented by 100%.

Runtime comparisons (on semi-logarithmic scale) of variants of the approximation solution, GH is the standard Gomory-Hu algorithm, AGH is our solution of the scheduling problem based on Gomory-Hu.
The approximation solution to the scheduling problem also proves to be a viable alternative from the complexity point of view. Asymptotically it has the same complexity as the Gomory-Hu algorithm it is based on, although with a higher constant.
Self-healing
The Self-healing service in the Check framework overlays the self-healing capabilities provided by the stack running on the nodes. The latter continuously ensures a correct topology of the island. The Self-healing service however understands more complex notions, such as constraints.
Software Requirements
- Linux PC (Ubuntu)
- g++, make
- libboost-dev, libboost-filesystem-dev or directly from site (minimum recommended version 1.44; in the boost folder: ./bootstrap.sh; ./bjam install)
Project Organization
The code for self-healing service can be found here.
- config.xml sample configuration file
Compiling the Self-healing service
Some packages are required to be installed prior to the compilation of the Self-healing service, as the Boost library for C++ is used. At the time of the creation of the code, the Ubuntu repositories hold an older version of the Boost library, which does not contain the Property Tree feature. So the sources of the library should be downloaded and compiled. Download version 1.44.0 from download site.
$ tar xjf boost_1_44_0.tar.bz2
$ cd boost_1_44_0
$ ./bootstrap.sh
$ ./bjam install
This will compile and completly install the Boost library, and copy the necessary header files in the /usr/local/include/ folder. Now they can be used in the code by simply: #include <boost/filesystem.hpp>
To compile the Self-healing service, you need to go in the Check-selfheal folder and:
make
To clean everything:
make clean
Running the Self-healing service
The Self-healing service can be run by simply:
./check-selfheal
Demo
For demo purposes, we have build two islands, using Raven and Sparrow nodes, each of the islands being connected through a SAM7X edge router to the gateway running on PC. For our demo scenario, let's suppose the two islands are adjacent (e.g. in the same building). Also let's imagine that we need to measure the mean temperature of the area covered by the islands.
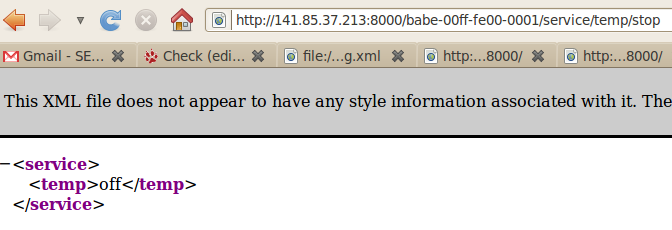
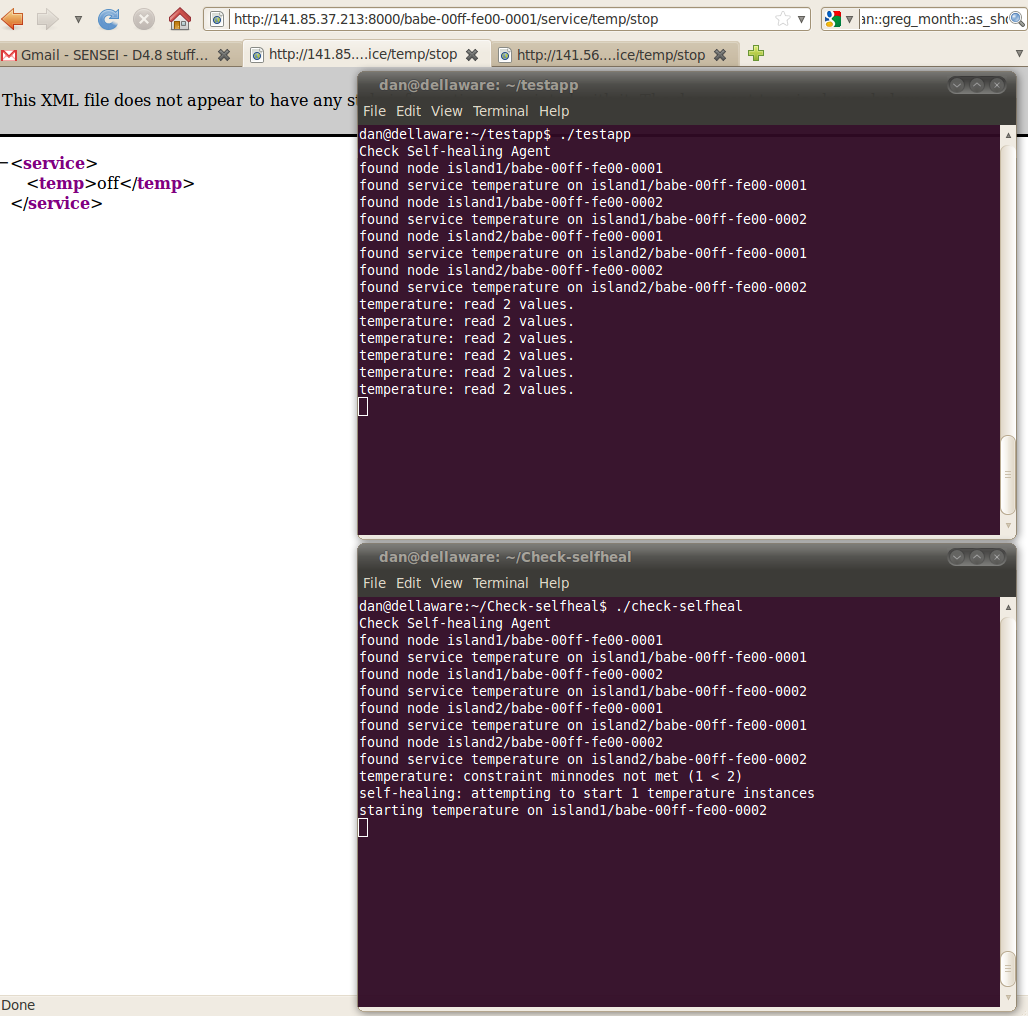
To simulate node failure, the nodes can be simply unplugged from their power source or the service running on them can be suspended using the appropriate URL, such as http://localhost:8000/babe-00ff-fe00-0001/service/temp/stop

Configuration
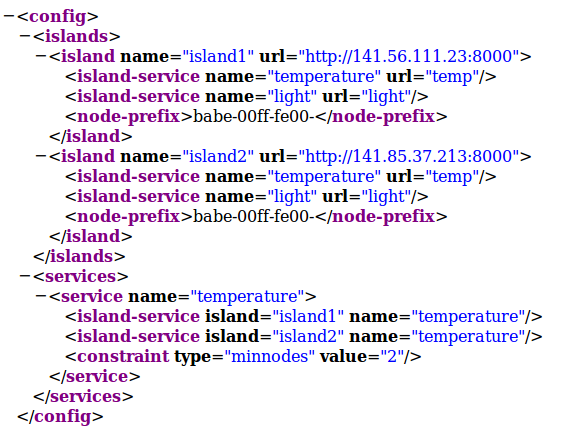
The Self-healing service becomes aware of the islands being monitored using a flexible and standard compliant xml file. For this demo, a sample config.xml file is provided:

The main entities described in the config.xml are:
- islands: each island is characterized by a name, its URL and a node name prefix
- services: the temperature service is described at a general level, with cross-island information, such as the constraints that need to be fulfilled to run that particular service (for our example, we consider that there need to be at least two nodes to obtain a mean temperature).
- island-service: the entities that connect islands and services, describing for each island the particularities that govern the service in that island, such as the URL of the resource on the nodes (in this case it is "temp" in both islands).
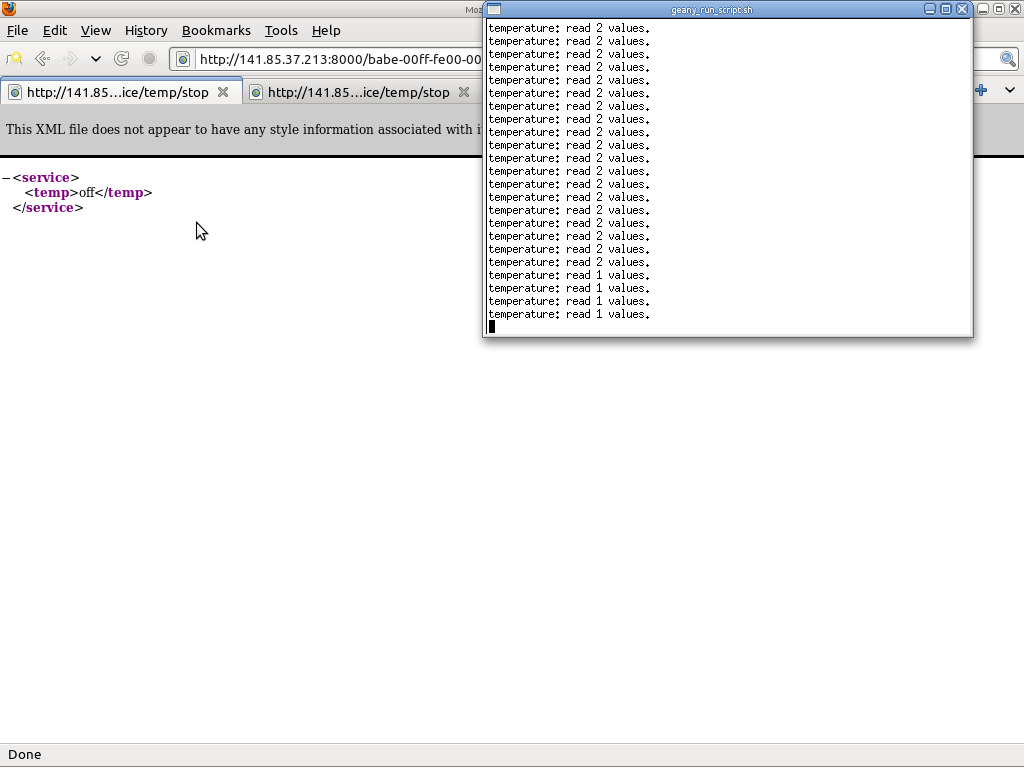
Demo 1: no Self-healing service
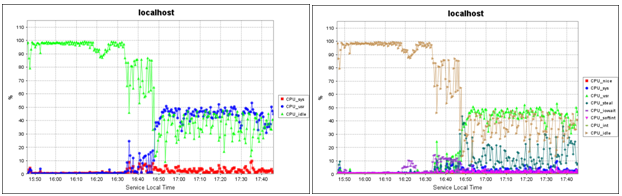
For testing purposes, we have also created a client application that requests temperature information from nodes running the appropriate service. The interval between requests has been arbitrarily been set at 2 seconds. In the screenshot, you may see that, when a node fails, the number of read values drops:

Demo 2: Self-healing inside an island
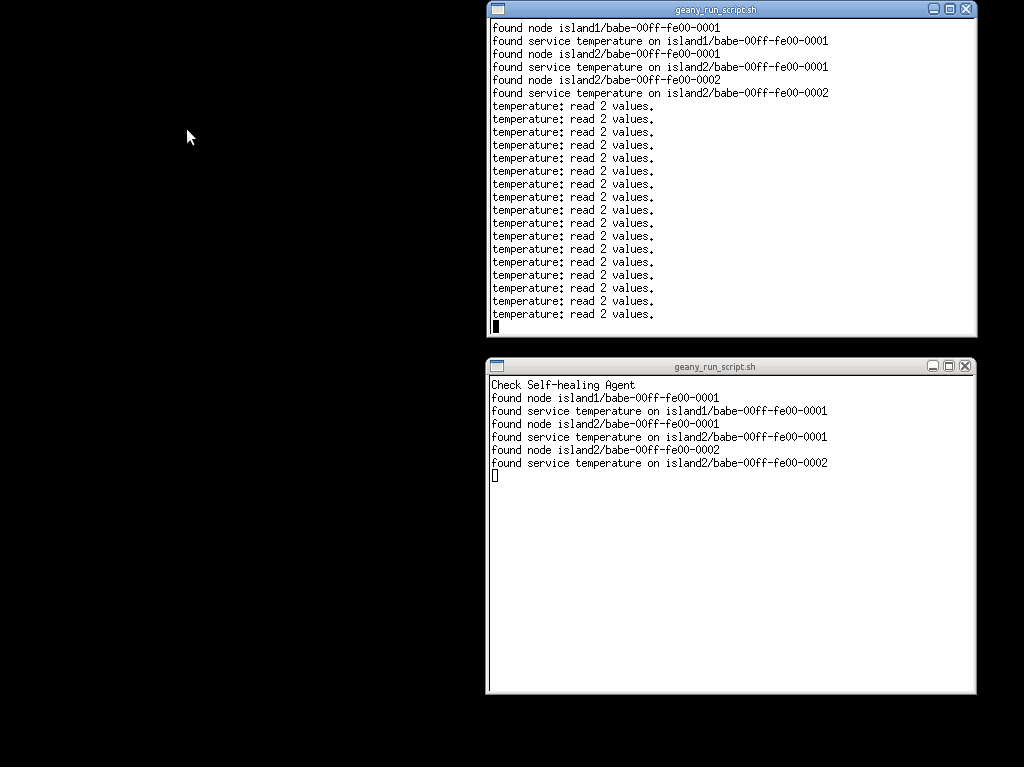
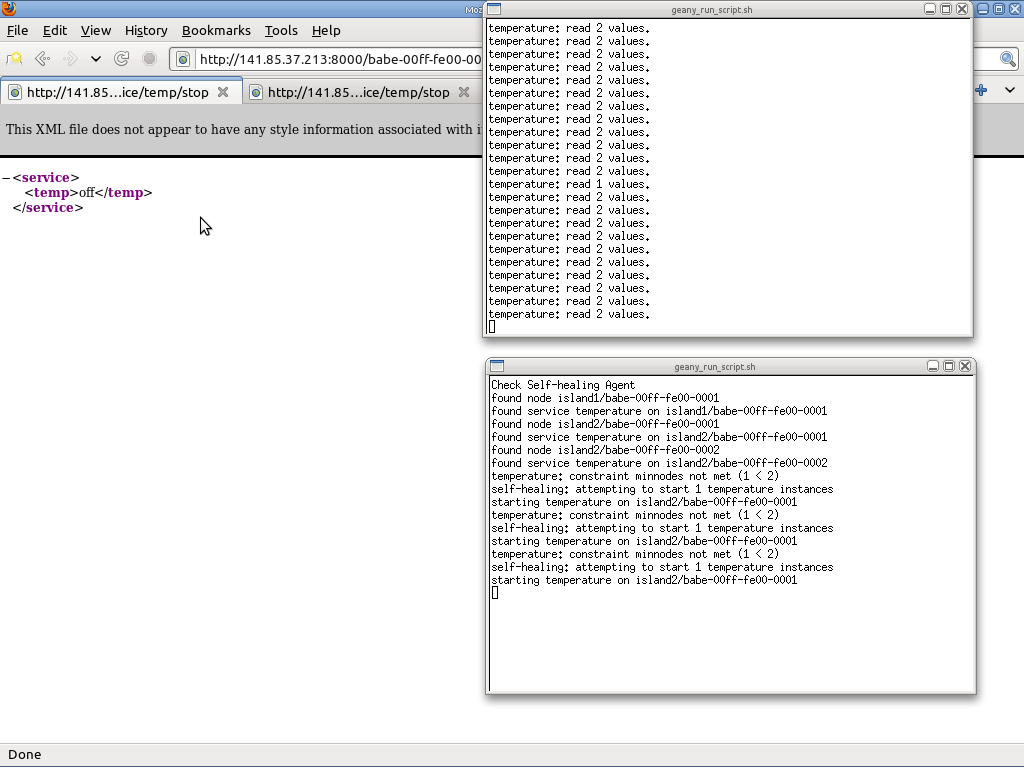
In this second demo we will be starting the Self-healing service and repeat the node failure simulation.
At the service's startup, it loads the config file and recognizes the resources that it needs to monitor (lower window):

We repeat the node failure several times. In the screenshot you may see that node failure was repeated three times, but each time the self-healing service starts the service on a node to fill-in for the missing information (lower window). Only once the node failure was so close to the client's request that the latter could only read 1 value (upper window). The other times, the nodes were up again in time for the client to read enough values:

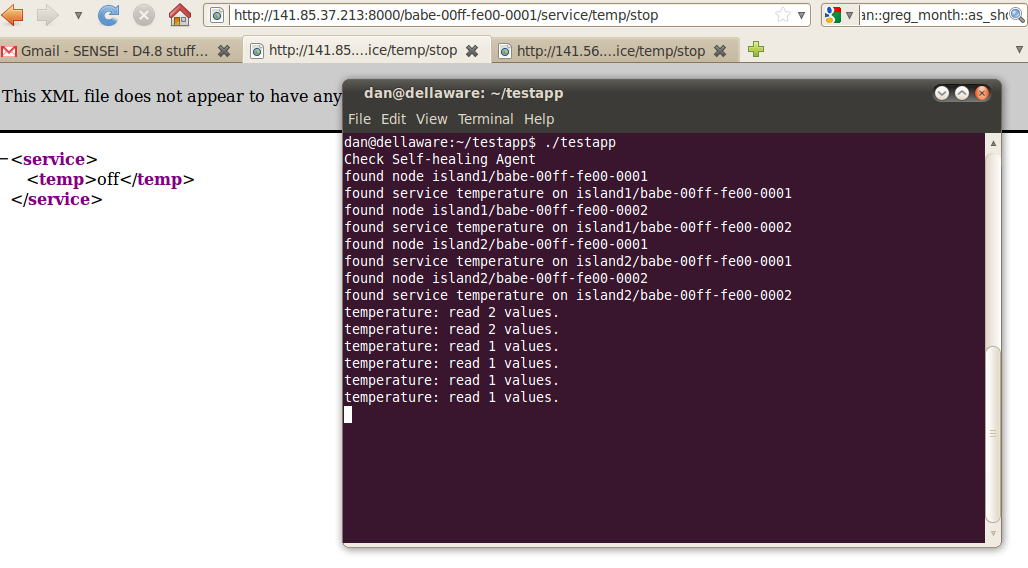
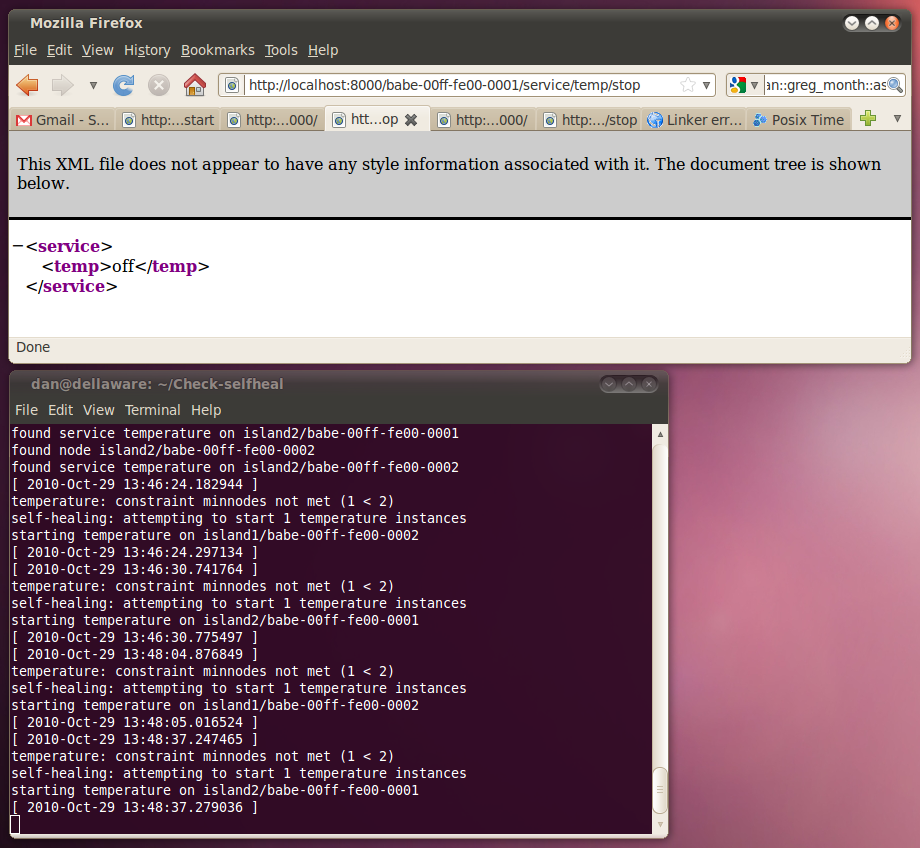
Demo 3: Self-healing across islands
Acting beyond the gateway level, the Self-healing service is able to compensate the lack of sensors in one island, with sensors in another island.
For this demo, we are using two islands, each with two nodes capable of measuring temperature. At the start, the temperature service on the two nodes in island1 is switched off and the temperature service on island2's nodes is switched on.
Running the test client shows that, without the help of the Self-healing sensor, the sensor readings lack inputs as nodes start failing.

Starting the Self-healing service changes this situation. Once a node fails, the service is able to start a node in either island. In the next screenshot, you may see how turning off the service on node 0001 in island2 (browser window) makes the Self-healing service turn on node 0002 in island1 (lower terminal):

Please note that not even a single sensor reading in the test client suffered of lack of sensors (upper terminal). In the next section, we detail a bit the timings.
Performance
The lag between the detection of a node failing and restoring the service, by turning it on for another node, is some tens of miliseconds. We have tried a few measurements, for both local islands and remote islands. In these examples, the Self-healing service is running in the same network as island2 and we introduce node failures causing node starts in both islands.

The data from the above screenshot is better shown in this table:
| Test no. | Node started | Timestamp of detection [s] | Timestamp of service restoration [s] | Lag [ms] |
|---|---|---|---|---|
| 1 | remote | 24.182 | 24.297 | 115 |
| 2 | local | 30.741 | 30.775 | 34 |
| 3 | remote | 04.876 | 05.016 | 140 |
| 4 | local | 37.247 | 37.279 | 32 |
You may notice that the mean restore time for local node starts is ~30-40 ms and the mean restore time for remote node starts is ~100-150 ms. The difference between remote and local times is most probably caused by network lag times. Remote times can vary even more depending on the connection between the computer running the Self-healing service and the node island.
Proposed Check Demonstration Sketch
To prove the functionality and benefits offered by the Check Management Protocol Suite, a demonstration employing multiple monitors on RZRaven, Sparrow and Sensinode islands will be used. These monitors will be working at the same time, switching whenever one of them will fail. Seamless operation, and the avoidance of service interruptions or delays due to failures occurring in the network will be shown by the Check Management Protocol Suite. The evaluation metric will measure the recovery time after an injected failure. The actual demonstration will provide a failure report after this failure injection. The demonstration will show the comparison of the functionality offered by the SENSEI system with and without the Check Protocol Suite. During the demonstration, some of the services offered by all the WSAN islands should become unavailable when the Check framework is not used upon failure injection. While Check is used or activated however, all services should be available and scheduled properly across all the WSAN islands in the system where they are installed. The behavior of all the nodes will be continuously visible remotely through the monitoring component of Check.
Attachments (22)
-
rd.png (94.4 KB) - added by 14 years ago.
Resource Directory query example
-
start.png (8.3 KB) - added by 14 years ago.
Start gateway response
-
stop.png (8.3 KB) - added by 14 years ago.
Stop gateway response
-
update2.png (14.8 KB) - added by 14 years ago.
Update example
- arhi.png (22.1 KB) - added by 14 years ago.
- sensei+rum.png (34.8 KB) - added by 14 years ago.
- telnet.png (18.7 KB) - added by 14 years ago.
- Monitor_screen1.png (77.6 KB) - added by 14 years ago.
- Monitor_screen2.png (82.9 KB) - added by 14 years ago.
- Percentage_task-scheduling.png (30.8 KB) - added by 13 years ago.
- Runtime_task-scheduling.png (34.4 KB) - added by 13 years ago.
-
NetworkTable.png (33.7 KB) - added by 13 years ago.
RUM network table with multihop
-
sh-config.png (72.2 KB) - added by 13 years ago.
Self-healing: configuration file
-
sh-suspend service.png (27.5 KB) - added by 13 years ago.
Self-healing: suspend the temp service on a node
-
sh-no service.png (43.6 KB) - added by 13 years ago.
Self-healing: nodes are failing without the self-healing service
-
sh-service startup.png (22.4 KB) - added by 13 years ago.
Self-healing: at service startup it recognizes the resources being monitored
-
sh-start node.png (56.4 KB) - added by 13 years ago.
Self-healing: the service starts a node to assure service constraints
-
sh-multi island failing.png (85.9 KB) - added by 13 years ago.
Self-healing: without the help of self-healing, sensor readings lack values
-
sh-multi island new node.png (138.1 KB) - added by 13 years ago.
Self-healing: the temperature service is started on a node in a different island
-
sh-performance.png (249.1 KB) - added by 13 years ago.
Self-healing: timings
- Monitor_screen1.jpg (157.2 KB) - added by 13 years ago.
- Monitor_screen2.jpg (58.9 KB) - added by 13 years ago.
Download all attachments as: .zip