| Version 16 (modified by , 14 years ago) (diff) |
|---|
Applications
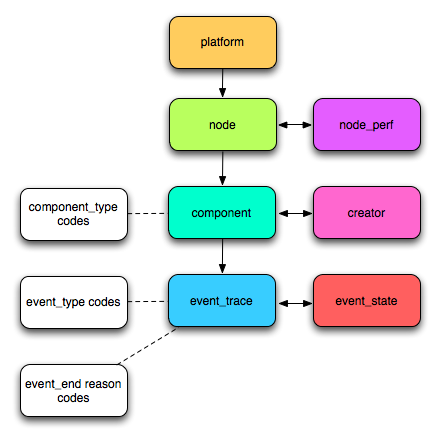
We decided to do several application in the realm of statistics on large amount of data, keeping in mind to choose them as different as possible so as to make the comparison more relevant. As a result, we chose some real world data, available online at INRIA Failure Trace Archive, having as an advantage the fact that data is structured and we could test the applications on various input sizes, from tens on MB to tens of GB. This data archive presents facts about job failures and the tales of interest for out applications are event_trace (a trace of events that failed), node (identifies nodes on which the jobs ran), component (describes component codes), event_trace.event_end_reason code. The trace format is organized hierarchically as follows: Platform → Node → Component → Event Trace. Below there is a full description of the failure trace archive.

We summary the meaning of each table below. Table names are shown in bold.
- A platform contains a set of nodes. Examples of a platform include SETI@home, desktops at Microsoft.
- A node contains a set of components, which is a software module or hardware resource of the node. Each node can have several components (e.g. CPU speed, availability memory, client availability), each of which has a corresponding trace.
- A component describes attributes of a software module or hardware resource of a node.
- component_perf is the component performance, as measured through benchmarks for example.
- A creator is the person responsible for the trace data set. This table stores details about citations and copyright.
- An event_trace is the trace of an event, with all of corresponding timing information
- event_state is the state corresponding to an event_trace. For example, for CPU availability, the event_state could be the idleness of the CPU. For host availability, it could be the monitoring information associated with the event.
Below there is a short description of each application:
- Which one of the fault reasons is the most frequent? This application uses the event_trace table, looking at event_end_reason column
- Which is the medium duration for events? This application uses the event_trace table, looking at event_start_time and event_end_time columns
- Which component is the most frequent as a fault cause? This application uses the event_trace table, using the component_id column and also the table component table, looking at component_type column
- Having a classification for job duration as short, medium and long, find out the most frequent (>1000) causes of failures for each of these categories. It uses event_trace table, looking at event_start_time and event_end_time columns and also event_trace.event_end_reason code table.
- For each category from event_trace.event_end_reason code ranges, which of event_trace.event_end_reason code definitions is the most frequent?
- Number of failures for each geographical location. This application uses the event_trace table, more precisely the columns platform_id and node_id so as to identify the nodes that failed, and then maps them with the location by using the table node, having among others the columns node.platform_id and node.node_id.
MapReduce
Making design choices for MapReduce is an intricate task. On the one hand, there are many decisions to be made, such as to have or not to have a Combiner (cuts down the amount of data transferred from the Mapper to the Reducer), a Partitioner (partitions the output of mappers per reducer), or even a CompressionCodec (compresses the intermediate outputs from mappers to reducers) or a Comparator to do a secondary sort before the reduce phase. On the other hand, complex combinations in specifying these extra features may lead to a too long development time, which is not worth it.
- We have tried two approaches here. The first one is to get the Mapper compute the jobs duration, giving the same key to each pair, and the Reducer will sum up all these values and compute the medium. Unfortunately, no Combiner can be specified here, as the Reducer would not know afterwards how many elements the Mapper generated.
The second approach is to compute the medium on chunks having a fixed size of elements, and then the result would be the medium of all these mediums. Although this is appropriate for specifying a Combiner, it will give an approximate value of the medium, depending on the distribution of values in each of the chunks. In this case, the Mapper will generate a new key for durations at each chunk number of pairs, the Combiner will make the medium for each chunk and output mediums having the same key, and the reduce will compute the medium like it did in the previous example.
- The Mapper classifies inputs and emits keys 'duration classification - reason' having the value of 1, while the Reducer counts the values and if they exceed 1000, they are outputted. The Combiner does basically the same thing as the Reducer.
- This is a more interesting application, as it requires a natural join between the node table and the event_trace table on platform_id and node_id fields. In order to do that, we concatenate the two join columns. The idea here is that the Mapper will read both files and will emit for a platform_id;node_id key values consisting both of values 1 (meaning the failures on that node), but also location. So after the map phase, we should have for a platform_id;node_id key many values of 1 and also a location. These paits will reach the Combiner, however depending on which of the Mappers found the location, some Combiners may receive amongst the values just values of 1, so the best effort here is to output the same key, but adding the 1 values. If the Combiner finds a locations between the values, it will output the pair without changing it. Now, in the third phase, all the pairs having the same keys reach the Reducer, who will sum the numeric values and output the location it finds amongst the values as a key. However, having multiple nodes in the same location, each reducer may output more than one numeric value for the same location, which then have to be some up. That's why we need a second map-reduce job, with an identity Mapper and a reducer that will just sum the values having the same key.
TODO Claudiu for his apps
Pig
On the contrary to MapReduce, writing code in PigLatin is as straight forward as it can get. There's no need to wory about how things are done, one just has to specify what needs to be done. Describing this seems more natural in PigLatin?, for example the b. program is just computing an average. As a general idea, one has to group what one would have used in MapReduce? as a key and a big advantage is that a join is much easier to do.
TODO Claudiu for his apps
MPI
The MPI approach is a low level one, where not only computation, but also explicit communication needs to be done.
For the d. application, one node will be the master and will establish what should be done and who should do it and the other will be slaves. The master divides the event_trace file into equal chunks and gives the slaves indexes from where each should read in a round-robin manner in an asynchronous manner. The master avoids the overhead of reading the whole file, however this means the slaves should first go from the first offset to the end of a line and then start reading. The slaves process each chunk and send a vector having all the combinations for job duration classification and failure cause having associated the number of failures registered. The master sums all the vectors it receives also in an asynchronous manner and if it doesn't receive anything for 10s, it stops the execution.
TODO Claudiu for his apps
Attachments (1)
- schema_fta.png (41.9 KB) - added by 14 years ago.
Download all attachments as: .zip